
Hi everyone,
a few months ago I had asked a question about displaying relations:
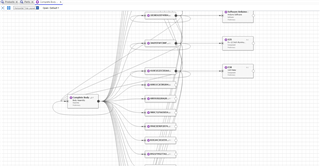
which led to creating a graph/web as shown below.
I've got 2 follow up questions:
- Is there a way to hide/remove the middle blocks with randomly generated ID numbers when I expand an 'Assembly'.
- Is there a way to give each "type" of block a different colour? (e.g. Assembly = red, Component = blue, Software = Purple")
Thanks in advance! I truly appreciated the help I got earlier.
I'm happy to answer questions if necessary.

