


Aras Innovator Self-Service Reporting is handy core capability users and administrators can use to easily create, modify, and run reports to get immediate insights for your enterprise! Reports can be securely shared in a multitude of formats providing charts with easy to follow visuals.
In this blog post we will be taking a look at this functionality through the creation of a simple report. Reports are very easy to create and are open to most users within the environment, but can also be restricted by the user who creates the report. We can restrict reports accordingly by either giving users Public, Private, or Shared with Identities access. If the access is Public, we can further specify:
- Full: Report is available to the user to view, modify, and save changes to the report.
- Read Only: Report is available to the user to view. User can add or remove filters, and modify existing filters' values. Also user can modify (design) the report but cannot change the original design. Save as, however, can be used to create a copy.
- View Only: Report is available to the user to view, but not modify in any way or save changes to the report.
- Locked access: Report is available to view only.
Lets take a look at this example using a Aras Innovator Demo instance with demo Part data. We will create a very basic report that displays the statuses of parts within the list of items.
Configuration:
Our report will consist of a table Pie Chart containing data displaying the number of parts in change, preliminary, and released statuses.
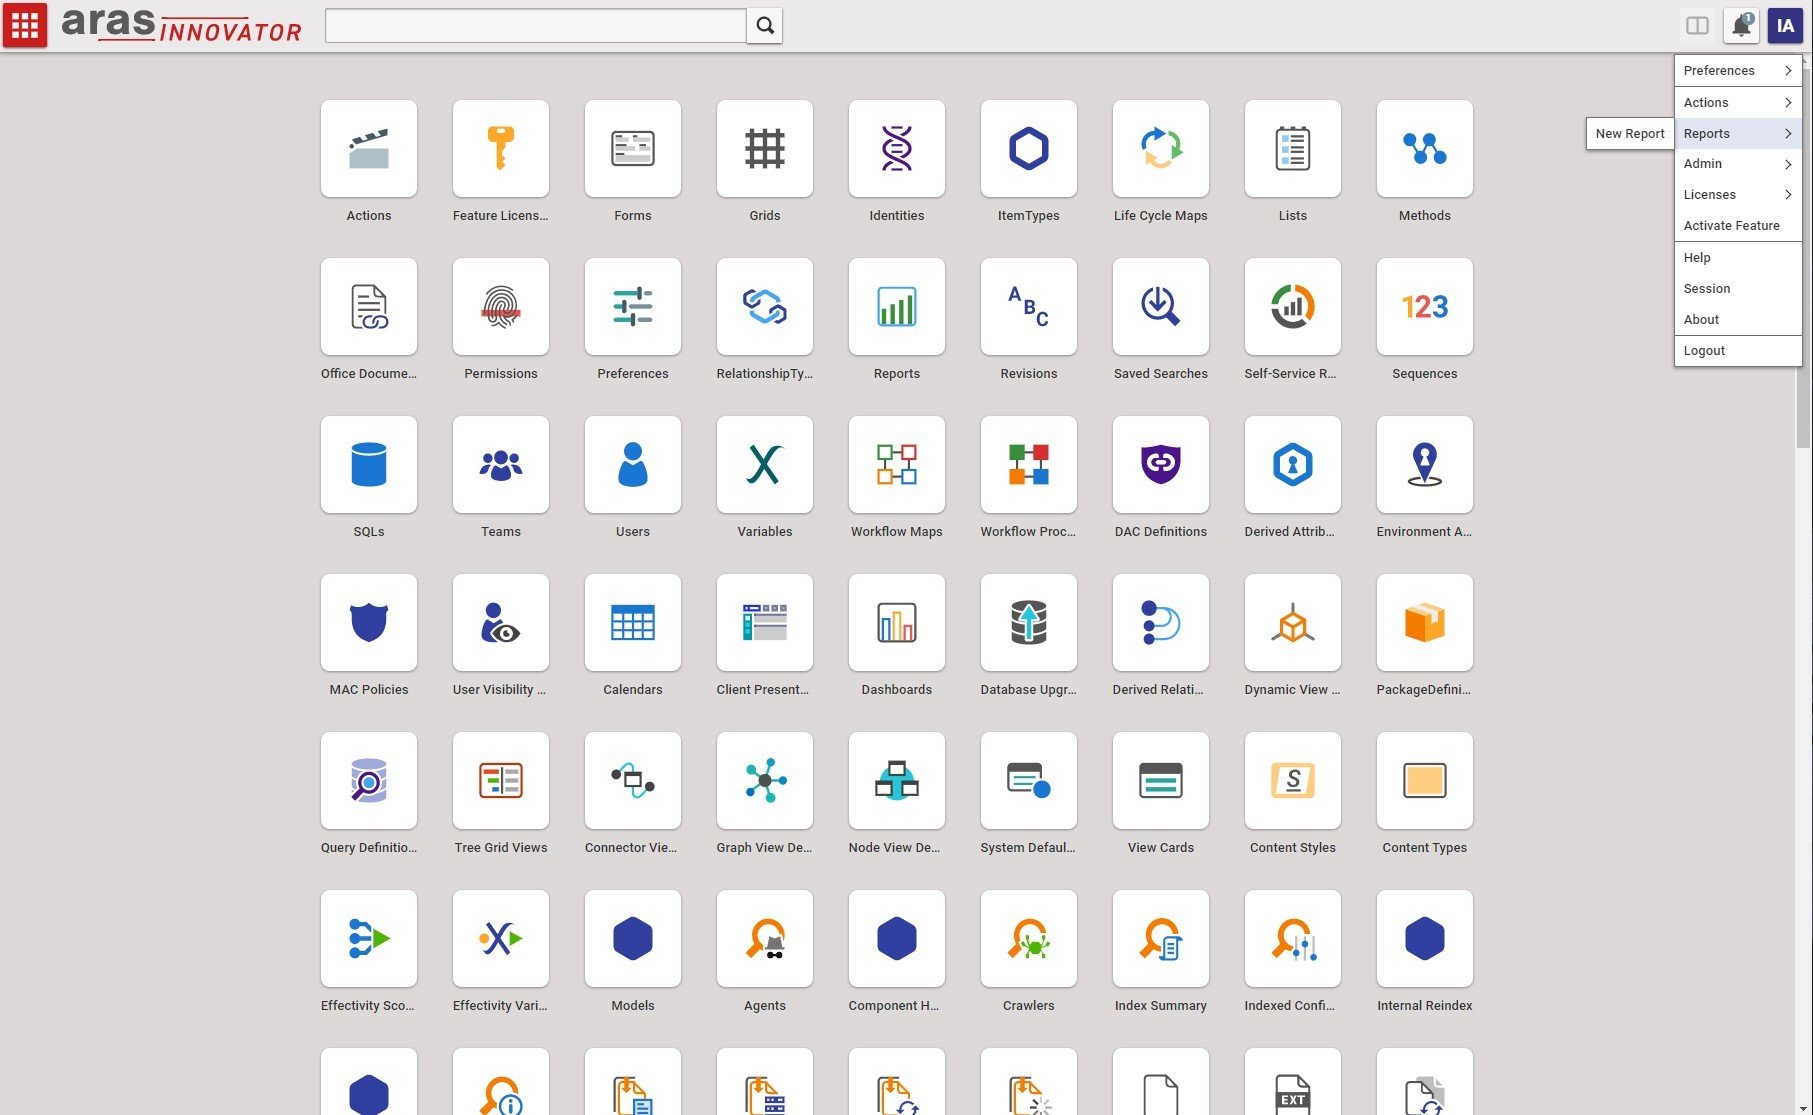
1. The first task we will perform is opening up the User Menu icon.
2. Select Reports, then New Report as depicted:
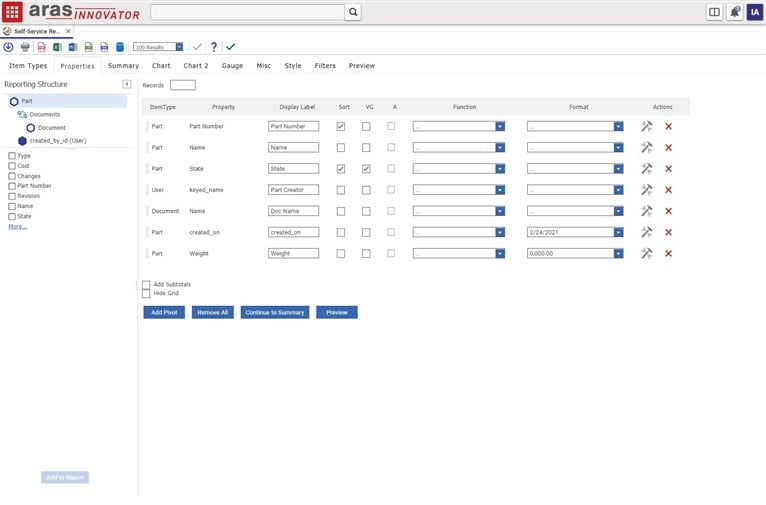
3. This will bring you to the Reports editor, which will contain an assortment of Top Level ItemTypes.
4. Go ahead and select the Part ItemType, which will bring up another selection.
5. This new selection contains properties we can add to the report, choose the Documents (Document) RelationshipType and create_by_id (User) properties.
6. At the bottom of the table click the Continue to Properties button.
7. Within this section we will select the following properties and fill in the details as shown below.
8. We can choose properties from the Structure table on the left, note some may be hidden so you’ll need to click the More… button to see all of them.
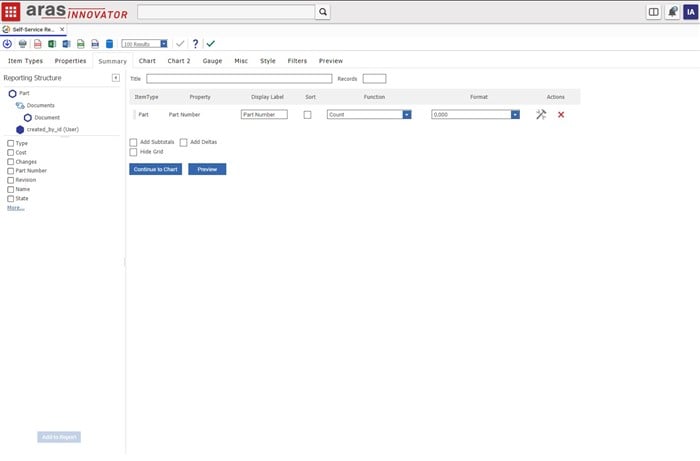
9. Moving on to the summary section, click the button labeled Continue to Summary below and then add a count for the Part Number property. This is what it will look like:
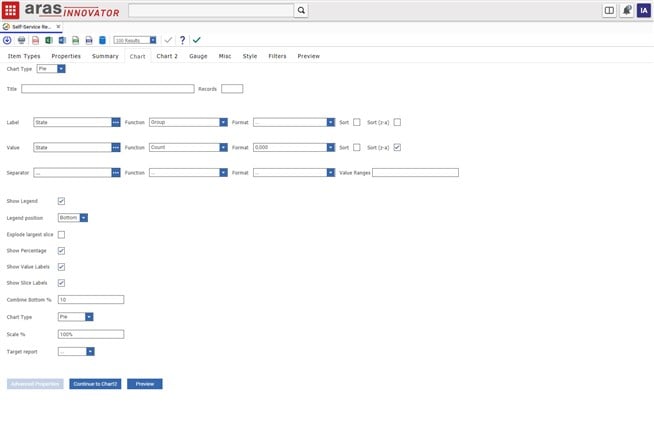
10. Next click the Continue to Chart button to create a Pie Chart for our State property. At the top dropdown select Pie and add group then count for the State property.
11. Click Advanced Properties and select Show Legend, Show Percentage, Show Value Labels, and Show Slice Labels.
12. After filling in those fields we can skip to the Misc tab and give our report a title/name (I will call mine Part Report) and set the availability to Public (Full) for the purposes of viewing. Note that we can restrict reports by view only, read only, locked, certain identities, and private as well.
13. Wrapping up we will add filters for the Part Number and created_on properties. Click the Filters tab and add the following properties:
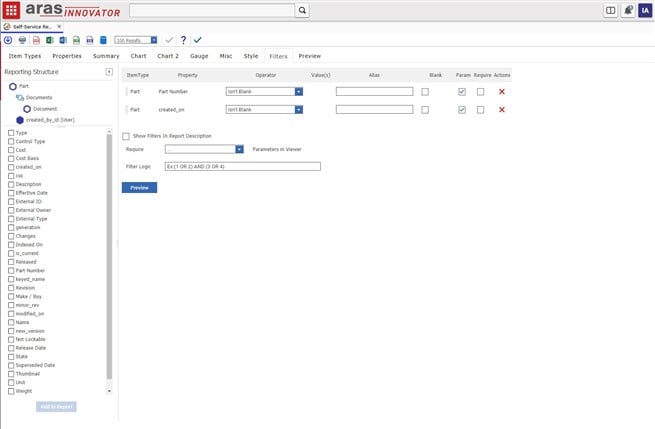
14. Clicking the Preview button below will generate our report, we can see the results are displayed on the Pie chart! You should also see tables containing the actual data for each state, In Change, Preliminary, and Released parts.
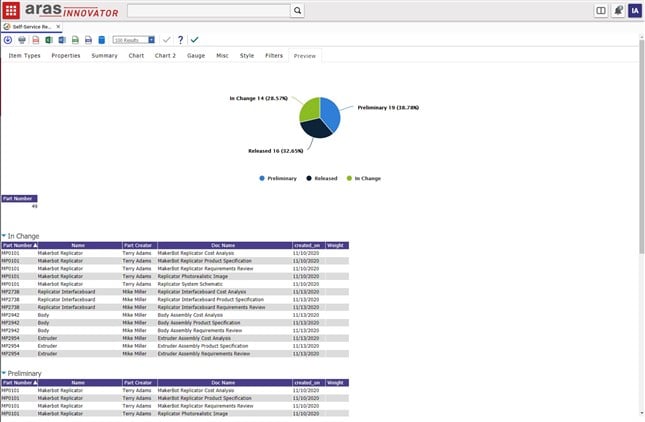
At the top you can further adjust the number of results displayed within the tables, export to other formats such as excel, CSV, PDF, etc.. Note there are a few more tabs we did not cover in this blog post such as the Style configurations which allows further customization of headers, colors, order, and more!
Conclusion:
Aras Innovator Self Service Reporting can be configured quickly and easily yet also contains insightful information to users through some extra configuration. Not only can we create tables on the fly, but fully configurable charts with their own styles, colors, and information. Let us know if your organization uses Self Service Reporting in the comments below and what reports you generate through it!