


Users of Aras Innovator know how the software empowers them to customize the data model to best fit their specific business practices. Once the data exists in the database, users can take advantage of a number of options in order to visualize the data. One of these ways is Tree Grid Views (TGV) which is great for conveniently displaying hierarchical data to your users. The basic options available in a TGV already enable helpful views, but, with a few simple tweaks, the functionality of these views can be extended even further.
Setup
In order to cover the different options that are available for configuring a TGV, we need a TGV that we can configure. We'll be using a very simple query that's intended to return all of the Group Identities in our database and the Identities that are members of them. For simplicity, this query is only going to return the immediate member Identities and will not do a recursive query to get the entire Identity structure.
Query Definition
If you want to follow along, you can configure your Query Definition like the screenshot below.
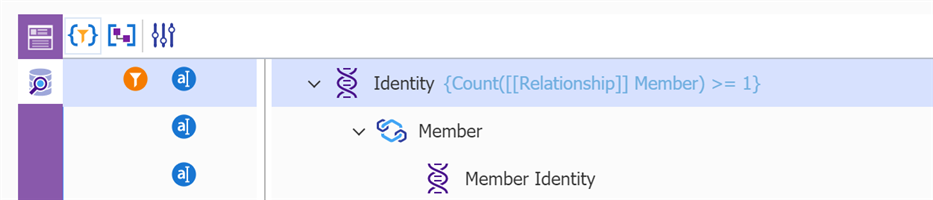
The context ItemType is Identity, and we've simply added the Member relationship to the query. We've mapped a few properties like Name, Description, and Item ID, and we've added a simple condition to the top-level so that only Identities that actually have Member relationships are returned.
Tree Grid View
The Tree Grid View is also configured very simply. We've mapped each element into our tree and have added a few columns to store all of the property information that our Query Definition is retrieving.
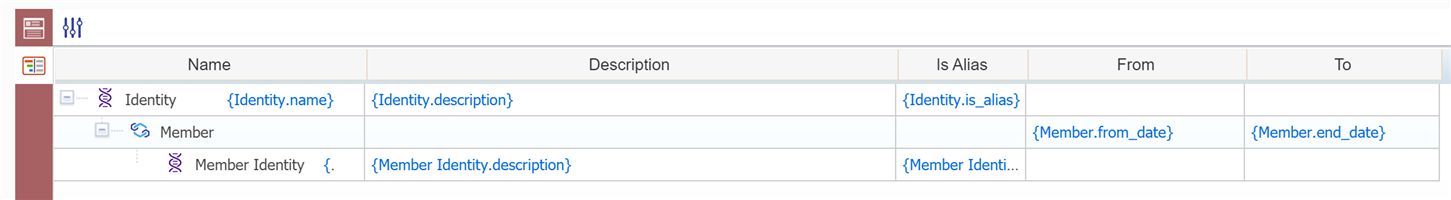
Note that the middle element for the Member relationship looks a little awkward. When we actually view this TGV, the first three cells are always going to be blank. However, we still want to display the data for the Start Date and End Date to our users. Can we configure our TGV to display this data so that we don't end up with those blank cells?
Combining Rows
Inside of the TGV editor, we can combine two different rows in order to display data from each element of our query in a single row. This can be extremely handy for displaying data from both a relationship and a related item together. For example, a query on the Part BOM could display the quantity from the Part BOM relationship inline with the actual related Part data. In our example, we can display the From Date and End Date properties on the same line as our Member Identity.
- Select both cells that you want to combine (Ctrl+Click)
- Right-click -> Combine
- A dialog will prompt you that all of the existing cell configuration is going to be erased. Click OK
- Configure the cells to display the appropriate property data
- Note that when you are configuring the cell mappings, you are now offered the options to select property data from both the related item and the relationship
After configuring your newly combined row, your new TGV should end up looking something like the screenshot below. As an additional note, you will only be able to combine rows that are adjacent to each other in the grid and that share a parent-child link like a relationship or an item property.
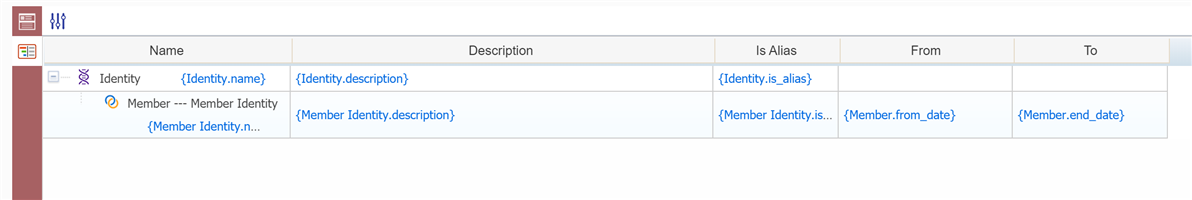
The icon of our combined row has now been replaced with a default. This is because the Tree Grid doesn't know if it should use the icon from the relationship or from the related item. Let's pick a new icon to give our users a little more information about what this data actually is.
- Right-click -> Change Icon
- In the Image Browser, switch to the Details View so you can see the names of the icons
- Scroll down and pick RelationshipType.svg
Now that our TGV is all set up, we need to display this to our users. Since this TGV is intended to be used as a supplement to the Identity Membership report, it would be great if we could add the option to view it right next to the Identity Membership report in the UI. Let's start by following the same steps we used in our basics blog post and run the Set Tree Grid View Usage action.
Opening a TGV with a Method
If you've followed along with your basics blog post, you've clicked through this screen while enabling your TGV.
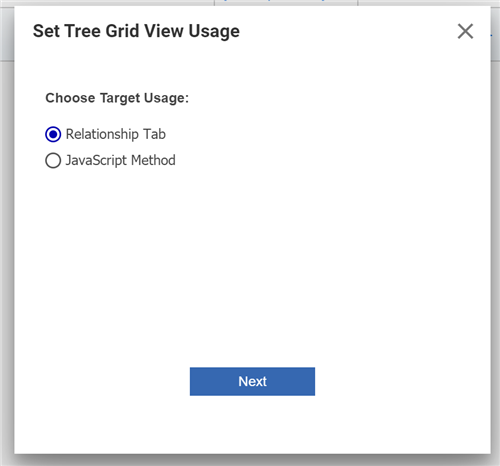
Usually, TGVs are enabled to be visible through a relationship tab when viewing an item. When viewed this way, Tree Grids filter the results that you see based on which item you have opened. For example, the standard Mutlilevel BOM TGV will only display the Part BOM structure of the Part you currently have opened.
The second option instead allows you to set up a TGV to be opened when a user runs an action. This option is best used for report-type views that either will be based on all of the items in your database and will not be filtered by a single context item. In this case, it's perfect for our Identity Membership TGV.
Configuration
After selecting JavaScript Method and clicking next, a tab for a new Method will be opened with some auto-generated code that can open our TGV. We could customize this method to do things like add a starting condition, but for our purposes, we just want to display all of the data our query returns as-is. We can simply click Done to save this Method. Now it's just a matter of adding an action to let the user call this Method.
The most obvious way to do this would be to create a new Action that calls our Method and then add a new Item Action to the Identity ItemType. This would work well enough, but the Identity ItemType has special permissions that require it to be changed by the Super User (root). The second option is to use the Configurable User Interface (CUI) to add a new menu option that can call our Method. This has the added benefit of not requiring us to actually lock the Identity ItemType, so we can do this all as a normal admin user.
- Login as admin
- Navigate to TOC > ItemTypes
- Search for and open the Identity ItemType
- While we are opening the Identity ItemType, we are not making direct modifications to it
- Navigate to the Client Style tab
- Open the existing item here
- In the Command Bar Section relationship tab, add a new item
- Classification - Data Model
- Name - Identity_pmig
- Location - PopupMenuItemGrid
- For Identity [...] - World
- Open this new item
- In the Command Bar Item relationship tab, add a new item
- ItemType - Menu
- Name - Identity.Identity_Membership_TGV.menu
- Action - Add
- Sort Order - 2550
- This will cause our option to appear next to the standard Identity Membership option
- For Identity [...] - World
- Open this item to finish configuring the information in the form
- Label - Identity Membership TGV
- Click Method - rb_showTGV_Identity Membership
- This should match the name of the auto-generated Method
- Image - TreeGridView.svg
- Save and Close the Command Bar Item
- Save and Close the Command Bar Section
- Save the Presentation Configuration
- Leave this tab open for a later step
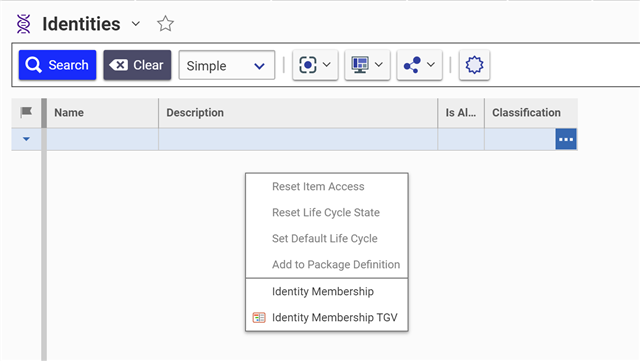
Once that's all configured, you can open up a new Identity search grid and right-click anywhere. You should see your new option visible in the context menu.
For good measure, let's also test this action just to make sure that everything is configured properly.
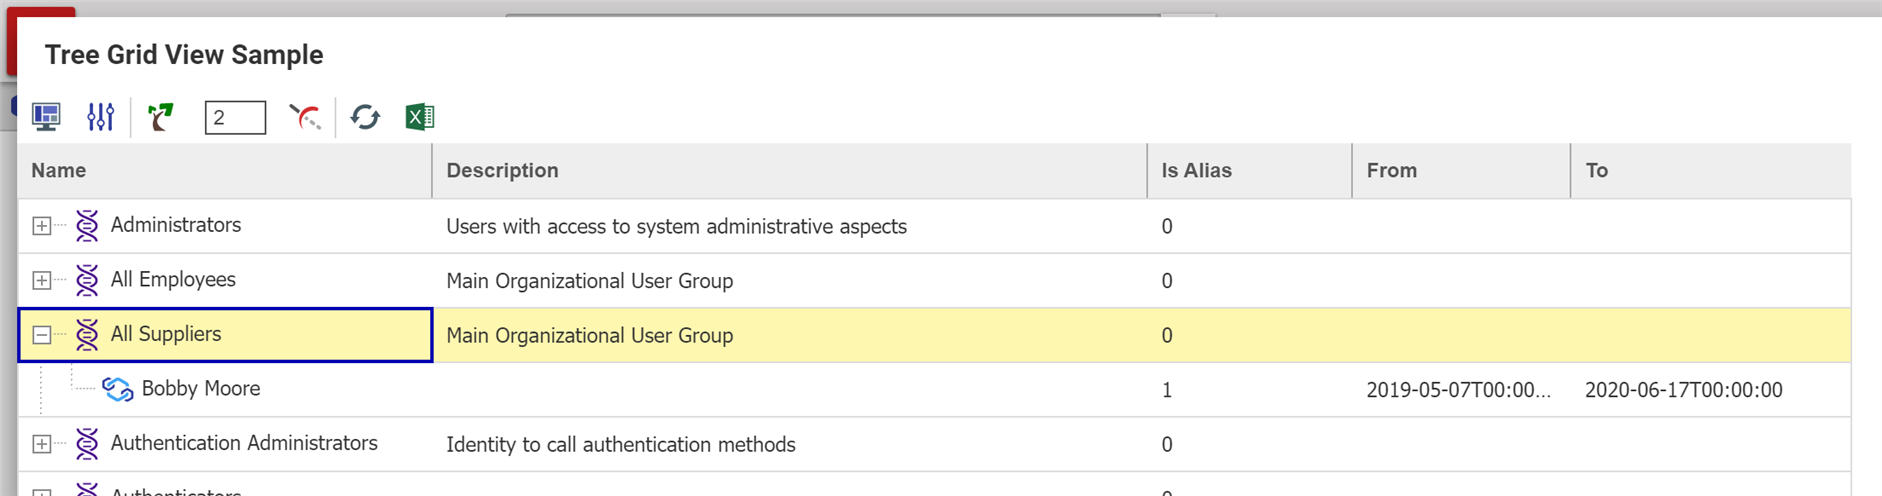
It's coming up as expected, and all of the data is there. The grid looks a little flat though. Our boolean value for Is Alias is displaying a 1 instead of a checkbox, and the date is in a really long, unfriendly format. Let's see what we can do to make this easier for our users.
Cell Display Settings
Let's navigate back to our TGV editor. While the cells in our grid currently map to individual properties, this doesn't have to be the case. The data templates of our cells support displaying multiple different properties inside of a single cell or even just static data that isn't mapped to any properties. Because of this, the styling of the cells doesn't default to display data based on the type of property that's mapped to it. We can change this pretty easily.
- Select one of the cells under Is Alias and Right-click -> Cell Display Settings
- In the Cell View Type dropdown in the top-right, select Boolean
- Repeat this for the second cell under Is Alias
We can also use a similar approach to fix the formatting of our dates.
- Select the cell under the From column and Right-click -> Cell Display Settings
- In the Cell View Type dropdown, select Date
- In the second Date Format dropdown that appears, select Short Date
- Repeat for the cell under the End column
Lastly, let's add an option to make it easier for our users to navigate through the system using our Tree Grid.
- Select one of the cells under Name and Right-click -> Cell Display Settings
- Change the Text Template to use the id/@keyed_name property
- In the Cell View Type dropdown, select Item
- In the ItemType Name field that appears, type Identity
- In the Item Property field that appears, type id
With all of these options configured, we can take another look at our TGV to see just how much it's improved.
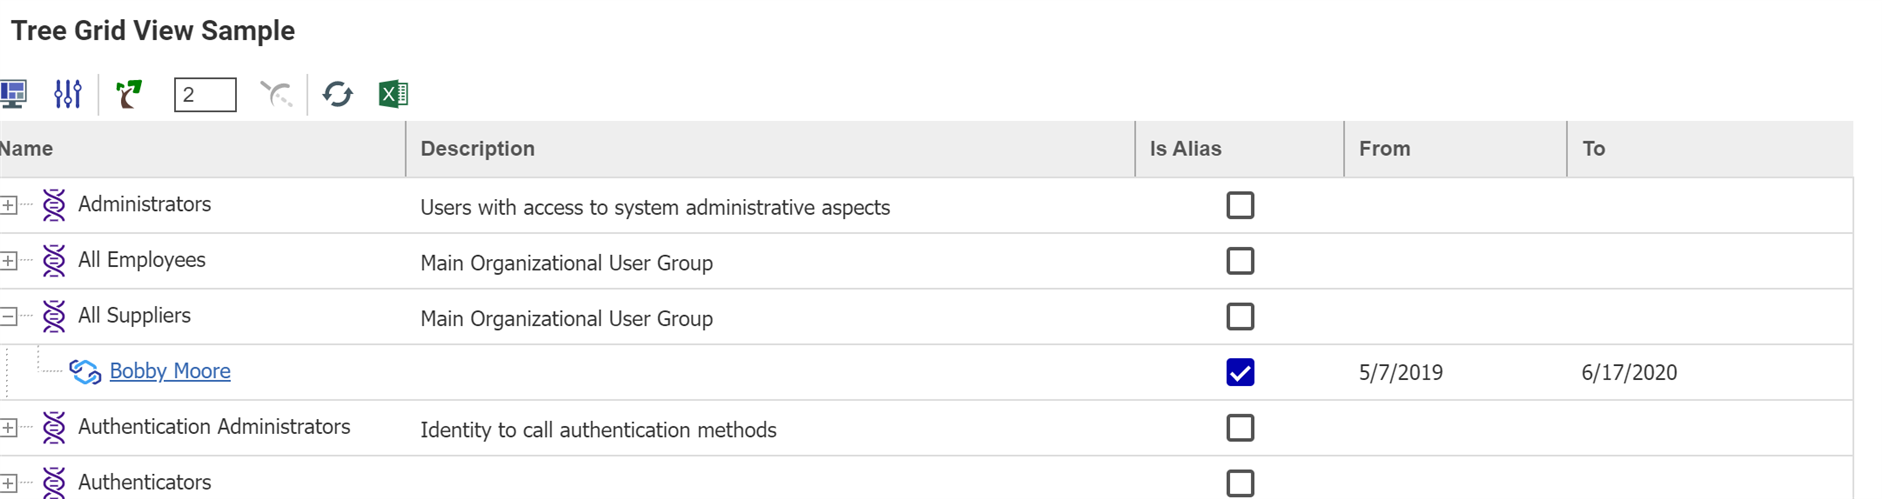
The grid looks a lot cleaner, and there's now even a handy link that will let our users open up the child Identities in a new tab.
Conclusion
While it's immensely important to be able to control how your data is stored in your database, it's equally important to consider how your users will view and interact with that data. If you are using a hierarchical data model, you should also be using Tree Grid Views. Look through your data model and use these steps to build a friendly one-window view for your users that will save them clicks and save you time.